European ASP.NET 4.5 Hosting BLOG

BLOG about ASP.NET 4, ASP.NET 4.5 Hosting and Its Technology - Dedicated to European Windows Hosting Customer

European ASP.NET Core Hosting :: Error When Published ASP.NET Core? See Below Tips!

clock November 5, 2019 05:38 by author Scott

At the past few years, we have discussed about common error that you can find when published .NET Core, the most common error is 502.5 – process failure error.

Startup errors with ASP.NET Core don’t provide much information either, at least not in a production environment. Here are 7 tips for understanding and fixing those errors.

1. There are two types of startup errors.

There are unhandled exceptions originating outside of the Startup class, and exceptions from inside of Startup. These two error types can produce different behavior and may require different troubleshooting techniques.

2. ASP.NET Core will handle exceptions from inside the Startup class.

If code in the ConfigureServices or Configure methods throw an exception, the framework will catch the exception and continue execution.

Although the process continues to run after the exception, every incoming request will generate a 500 response with the message “An error occurred while starting the application”.

Two additional pieces of information about this behavior:

- If you want the process to fail in this scenario, call CaptureStartupErrors on the web host builder and pass the value false.

- In a production environment, the “error occurred” message is all the information you’ll see in a web browser. The framework follows the practice of not giving away error details in a response because error details might give an attacker too much information. You can change the environment setting using the environment variable ASPNETCORE_ENVIRONMENT, but see the next two tips first. You don’t have to change the entire environment to see more error details.

3. Set detailedErrors in code to see a stack trace.

The following bit of code allows for detailed error message, even in production, so use with caution.

public static IWebHostBuilder CreateWebHostBuilder(string[] args) =>
    WebHost.CreateDefaultBuilder(args)
           .CaptureStartupErrors(true) // the default
           .UseSetting("detailedErrors", "true")
           .UseStartup<Startup>();

4. Alternatively, set the ASPNETCORE_DETAILEDERRORS environment variable.

Set the value to true and you’ll also see a stack trace, even in production, so use with caution.

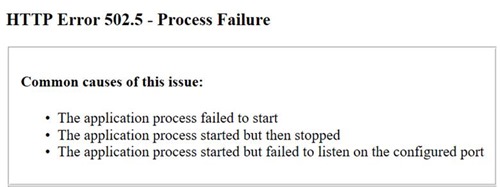
5. Unhandled exceptions outside of the Startup class will kill the process.

Perhaps you have code inside of Program.cs to run schema migrations or perform other initialization tasks which fail, or perhaps the application cannot bind to the desired ports. If you are running behind IIS, this is the scenario where you’ll see a generic 502.5 Process Failure error message.

These types of errors can be a bit more difficult to track down, but the following two tips should help.

6. For IIS, turn on standard output logging in web.config.

If you are carefully logging using other tools, you might be able to capture output there, too, but if all else fails, ASP.NET will write exception information to stdout by default. By turning the log flag to true, and creating the output directory, you’ll have a file with exception information and a stack trace inside to help track down the problem.

The following shows the web.config file created by dotnet publish and is typically the config file in use when hosting .NET Core in IIS. The attribute to change is the stdoutLogEnabled flag.

<system.webServer>
  <handlers>
    <add name="aspNetCore" path="*" verb="*" modules="AspNetCoreModule" resourceType="Unspecified" />

  </handlers>
  <aspNetCore processPath="dotnet" arguments=".\codes.dll"
              stdoutLogEnabled="true" stdoutLogFile=".\logs\stdout" />
</system.webServer>

Important: Make sure to create the logging output directory.

Important: Make sure to turn logging off after troubleshooting is complete.

7. Use the dotnet CLI to run the application on your server.

If you have access to the server, it is sometimes easier to go directly to the server and use dotnet to witness the exception in real time. There’s no need to turn on logging or set and unset environment variables.

Summary

Debugging startup errors in ASP.NET Core is a simple case of finding the exception. In many cases, #7 is the simplest approach that doesn’t require code or environment changes. FYI, we also have support latest ASP.NET Core on our hosting environment. Feel free to visit our site at https://www.hostforlife.eu.


European ASP.NET Core Hosting :: How to Measure and Report the Response Time of ASP.NET Core

clock November 8, 2018 09:57 by author Scott

Performance is a buzzword for APIs. One of the most important and measurable parameters of the API performance is the response time. In this article, we will understand how to add code to measure the response time of an API and then return the response time data to the end client.

What is the need for this?

So, let's take a moment to think why we would ever need such a feature to measure the Response time of an API. Following are some of the points that have been the inspiration for writing code to Capture response time.

  • You need to define the SLA (Service Level Agreements) for your API with your clients. The clients need to understand how much time  the API takes to respond back. The response time data over time can help us decide on an SLA for our API.
  • Management is interested in reports as to how fast or slow the application is. You need to have data to corroborate your claims. It is worth it to have reports on the performance of the application and to share it with Stakeholders.
  • The client needs to have the information of the Response time of the API so that they can track how much time is spent on the client and the Server.

You might also have encountered similar requests in your project and it is worthwhile looking at an approach to capture the response time for the API.

Where to add the code?

Let's explore a couple of approaches to capture the response time of our API focusing mostly on capturing the time spent in our API. Our objective is to calculate the time elapsed in milliseconds from the time the request is received by the Asp.net core runtime to the time the response is processed and sent back from the Server.

What factors are we ignoring?

It's important to understand that this discussion doesn't include the time spent in N/W, Time spent in IIS and Application Pool Startup. If the Application Pool wasn't up and running, then the first request can affect the overall response time of the API. There is an Application Initialization Module which we can make use of but that is out of scope for this article.

First Attempt

One very naive approach to capturing the response time of an API would be to add code to every API method at the start and end and then measure the delta to calculate the response time as shown 

// GET api/values/5   
[HttpGet]  
public IActionResult Get() {  
    // Start the watch   
    var watch = new Stopwatch();  
    watch.Start();  
    // Your actual Business logic   
    // End the watch  
    watch.Stop();  
    var responseTimeForCompleteRequest = watch.ElapsedMilliseconds;  
} 

This code should be able to calculate the time spent in an operation. But this doesn't seem to be the right approach for the following reasons.

If an API has a lot of operations, then we need to add this code to multiple places which are not good for maintainability.

This code measures the time spent in the method only, it doesn't measure the time spent on other activities like middleware, filters, Controller selection, action method selection, Model binding etc.

Second Attempt

Let's try to improve the above code by centralizing the code in one place so that it is easier to maintain. We need to execute the response time calculation code before and after a method is getting executed. If you have worked with earlier versions of Asp.net Web API, you would be familiar with concepts of Filter. Filters allow you to run code before or after specific stages in the request processing pipeline.

We will implement a filter for calculating the Response time as shown below. We will create a Filter and use the OnActionExecuting to start the timer and then stop the timer in method OnActionExecuted, thus calculating the response time of the API.

public class ResponseTimeActionFilter: IActionFilter { 
    private const string ResponseTimeKey = "ResponseTimeKey"; 
    public void OnActionExecuting(ActionExecutingContext context) { 
        // Start the timer  
        context.HttpContext.Items[ResponseTimeKey] = Stopwatch.StartNew(); 
    } 
    public void OnActionExecuted(ActionExecutedContext context) { 
        Stopwatch stopwatch = (Stopwatch) context.HttpContext.Items[ResponseTimeKey]; 
        // Calculate the time elapsed  
        var timeElapsed = stopwatch.Elapsed; 
    } 
}  

This code is not a reliable technique for calculating the response time as it doesn't address the issue of calculating the time spent in execution of middleware, controller selection, action method selection, model binding etc. The filter pipeline runs after the MVC selects the action to execute. So, it effectively doesn't instrument the time spent in the Other Asp.net pipeline. 

Third Attempt

We will use the Asp.net Core Middleware to Calculate the Response time of the API.

So, what is Middleware?

Basically, Middleware are software components which handle the Request/Response. Middleware is assembled into an application pipeline and serves in the incoming request. Each component does the following operations.

  • Chooses whether to pass the request to the next component in the pipeline. 
  • Can perform work before and after the next component in the pipeline is invoked.

If you have worked with HTTPModules or HTTPHandlers in ASP.NET, then you can think of Middleware as a replacement in ASP.NET Core. Some of the examples of middleware are -

  • MVC Middleware
  • Authentication
  • Static File Serving
  • Caching
  • CORS


We want to add code to start the timer once the request enters the ASP.NET Core pipeline and stop the timer once the response is processed by the Pipeline. Custom Middleware at the start of the request pipeline seems to be the best approach for getting the access to the request as early as possible and access until the last step is executed in the pipeline.

We will build a Response Time Middleware which we will add as the first Middleware to the request Pipeline so that we can start the timer as soon the request enters the Asp.net core pipeline.

What to do with the Response time data?

Once we capture the response time data we can process data in the following ways.

  1. Add the Response time data to a Reporting database or an analytics solution.
  2. Write the Response time data to a log file.
  3. Pass the response time data to a message queue which can further be processed by another application for reporting and analytics.
  4. Send the Response time information to the client applications consuming our Rest API using the Response headers.
  5. There may be other useful ways of using the response time data. Please leave a comment and tell me how you process the response time data in your application.

Let's write the code

We will write the code considering the following points.

  • Calculating the response time data for the API
  • Reporting the data back to client applications by passing the data in the Response headers.

Full code snippet for the ResponseTimeMiddleware is shown below.

public class ResponseTimeMiddleware { 
    // Name of the Response Header, Custom Headers starts with "X-"
 
    private const string RESPONSE_HEADER_RESPONSE_TIME = "X-Response-Time-ms";
 
    // Handle to the next Middleware in the pipeline
 
    private readonly RequestDelegate _next;
 
    public ResponseTimeMiddleware(RequestDelegate next) {
 
        _next = next;
 
    }
 
    public Task InvokeAsync(HttpContext context) {
 
        // Start the Timer using Stopwatch
 
        var watch = new Stopwatch();
 
        watch.Start();
 
        context.Response.OnStarting(() => {
 
            // Stop the timer information and calculate the time
  
            watch.Stop();
 
            var responseTimeForCompleteRequest = watch.ElapsedMilliseconds;
 
            // Add the Response time information in the Response headers.
  
            context.Response.Headers[RESPONSE_HEADER_RESPONSE_TIME] = responseTimeForCompleteRequest.ToString();
 
            return Task.CompletedTask;
 
        });
 
        // Call the next delegate/middleware in the pipeline
  
        return this._next(context);
 
    }
 
}

Explanation of the code

The interesting part happens in the InvokeAsync method, We use Stopwatch class to start the stopwatch once the requests enter into the first middleware of the request and then stop the stopwatch once the request has been processed and the response is ready to be sent back to the client. OnStarting method provides an opportunity to write a custom code to add a delegate to be invoked just before response headers will be sent to the client.

Lastly, we add the Response time information in a Custom Header. We use the X-Response-Time-msheader as a Response Header. As a convention, the Custom Header starts with an X.

Conclusion

In this article, we understood how to leverage ASP.NET middleware to manage cross-cutting concerns like measuring the response time of the APIs. There are various other useful use cases of using middleware which can help to reuse code and improve the maintainability of the application.

/p>


About HostForLIFE.eu

HostForLIFE.eu is European Windows Hosting Provider which focuses on Windows Platform only. We deliver on-demand hosting solutions including Shared hosting, Reseller Hosting, Cloud Hosting, Dedicated Servers, and IT as a Service for companies of all sizes.

We have offered the latest Windows 2016 Hosting, ASP.NET Core 2.2.1 Hosting, ASP.NET MVC 6 Hosting and SQL 2017 Hosting.


Tag cloud

Sign in