July 16, 2014 11:48 by
 Peter
Peter
Sometimes, we will get requirements where we need to zip the files at runtime before sending it to the client side. For example, if our ASP.NET 4.5.2 application allows users to download multiple files at a time it will be better if we can zip it as a single file and make it available in a single download instead of downloading them individually. Doing this will give performance benefits and better user experience. Today, I wanted a simple way to create a backup of my posts, without resorting to FTP. My solution is to create a URL that allows me to download the entire posts folder as a zip archive. To do the zipping, I used DotNetZip which is available as a nuget package and has a nice clean API.

Then in the Razor view (e.g. export.cshtml), the following code can be used to create a zip archive:
@using Ionic.Zip
@{
Response.Clear();
Response.BufferOutput = false; // for large files
System.Web.HttpContext c= System.Web.HttpContext.Current;
string archiveName= String.Format("archive-{0}.zip",
DateTime.Now.ToString("yyyy-MMM-dd-HHmmss"));
Response.ContentType = "application/zip";
Response.AddHeader("content-disposition", <br> "filename=" + archiveName);
var postsFolder = Server.MapPath("~/posts");
using (ZipFile zip = new ZipFile())
{
zip.AddDirectory(postsFolder);
zip.AddEntry("Readme.txt",
String.Format("Archive created on {0}", DateTime.Now);
zip.Save(Response.OutputStream);
}
Response.Close();
}
It’s very straightforward, and I have also shown adding your own custom readme.txt from a string. If you’d rather add each file manually, just provide an enumeration of files to add to zip.AddFiles.
Finally, it would probably not be a great idea to let anyone call this, so you can protect it with a simple call to IsAuthenticated:
if (User.Identity.IsAuthenticated)

June 24, 2014 07:04 by
 Peter
Peter
Today, I want to explain how to use Chart in ASP.NET 4.5.2, in Data Section. When you want to display your data with graphic and chart, you can use Chart. The Chart can render an image that displays data in a variety of chart types. Chart can render more than 30 types of charts, including all the types of charts that you might be familiar with from Microsoft Excel or other tools (area charts, bar charts, column charts, line charts, and pie charts, along with more specialized charts like stock charts).
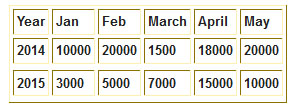
And here is the Table Design.


And Here is the Code
<body>
<form id="form1" runat="server">
<div>
<asp:Chart ID="Chart1" runat="server" BorderlineWidth="0" Width="550px">
<Series>
<asp:Series Name="Series1" XValueMember="Year" YValueMembers="Jan" LegendText="Jan" IsValueShownAsLabel="false" ChartArea="ChartArea1" MarkerBorderColor="#DBDBDB"></asp:Series>
<asp:Series Name="Series2" XValueMember="Year" YValueMembers="Feb" LegendText="Feb" IsValueShownAsLabel="false" ChartArea="ChartArea1" MarkerBorderColor="#DBDBDB"></asp:Series>
<asp:Series Name="Series3" XValueMember="Year" YValueMembers="March" LegendText="March" IsValueShownAsLabel="false" ChartArea="ChartArea1" MarkerBorderColor="#DBDBDB"></asp:Series>
<asp:Series Name="Series4" XValueMember="Year" YValueMembers="April" LegendText="April" IsValueShownAsLabel="false" ChartArea="ChartArea1" MarkerBorderColor="#DBDBDB"></asp:Series>
<asp:Series Name="Series5" XValueMember="Year" YValueMembers="May" LegendText="May" IsValueShownAsLabel="false" ChartArea="ChartArea1" MarkerBorderColor="#DBDBDB"></asp:Series>
</Series>
<Legends>
<asp:Legend Title="Month"></asp:Legend>
</Legends>
<Titles>
<asp:Title Docking="Bottom" Text="Percentage"></asp:Title>
</Titles>
<ChartAreas>
<asp:ChartArea Name="ChartArea1"></asp:ChartArea>
</ChartAreas>
</asp:Chart>
</div>
</form>
</body>
Aspx.Cs coding
SqlConnection con = new SqlConnection("Your Connection String");
protected void Page_Load(object sender, EventArgs e)
{
if (!IsPostBack)
{
FetchReportData();
}
}
public void FetchReportData()
{
SqlCommand cmd = new SqlCommand("select * from Percentage",con);
SqlDataAdapter da = new SqlDataAdapter(cmd);
DataSet ds = new DataSet();
da.Fill(ds);
Chart1.DataSource = ds;
Chart1.DataBind();
}