
June 24, 2014 07:04 by
 Peter
Peter
Today, I want to explain how to use Chart in ASP.NET 4.5.2, in Data Section. When you want to display your data with graphic and chart, you can use Chart. The Chart can render an image that displays data in a variety of chart types. Chart can render more than 30 types of charts, including all the types of charts that you might be familiar with from Microsoft Excel or other tools (area charts, bar charts, column charts, line charts, and pie charts, along with more specialized charts like stock charts).
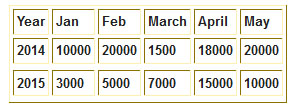
And here is the Table Design.

And Here is the Code
<body>
<form id="form1" runat="server">
<div>
<asp:Chart ID="Chart1" runat="server" BorderlineWidth="0" Width="550px">
<Series>
<asp:Series Name="Series1" XValueMember="Year" YValueMembers="Jan" LegendText="Jan" IsValueShownAsLabel="false" ChartArea="ChartArea1" MarkerBorderColor="#DBDBDB"></asp:Series>
<asp:Series Name="Series2" XValueMember="Year" YValueMembers="Feb" LegendText="Feb" IsValueShownAsLabel="false" ChartArea="ChartArea1" MarkerBorderColor="#DBDBDB"></asp:Series>
<asp:Series Name="Series3" XValueMember="Year" YValueMembers="March" LegendText="March" IsValueShownAsLabel="false" ChartArea="ChartArea1" MarkerBorderColor="#DBDBDB"></asp:Series>
<asp:Series Name="Series4" XValueMember="Year" YValueMembers="April" LegendText="April" IsValueShownAsLabel="false" ChartArea="ChartArea1" MarkerBorderColor="#DBDBDB"></asp:Series>
<asp:Series Name="Series5" XValueMember="Year" YValueMembers="May" LegendText="May" IsValueShownAsLabel="false" ChartArea="ChartArea1" MarkerBorderColor="#DBDBDB"></asp:Series>
</Series>
<Legends>
<asp:Legend Title="Month"></asp:Legend>
</Legends>
<Titles>
<asp:Title Docking="Bottom" Text="Percentage"></asp:Title>
</Titles>
<ChartAreas>
<asp:ChartArea Name="ChartArea1"></asp:ChartArea>
</ChartAreas>
</asp:Chart>
</div>
</form>
</body>
Aspx.Cs coding
SqlConnection con = new SqlConnection("Your Connection String");
protected void Page_Load(object sender, EventArgs e)
{
if (!IsPostBack)
{
FetchReportData();
}
}
public void FetchReportData()
{
SqlCommand cmd = new SqlCommand("select * from Percentage",con);
SqlDataAdapter da = new SqlDataAdapter(cmd);
DataSet ds = new DataSet();
da.Fill(ds);
Chart1.DataSource = ds;
Chart1.DataBind();
}