Use Devexpress Charts to give your.NET MAUI projects a boost! This blog post will walk you through the process of utilizing the free lifetime plugin Dev Express to implement the chart in.NET MAUI projects. With so many customization options, this plugin will jump straight to the implementation section.

Establishing the Project
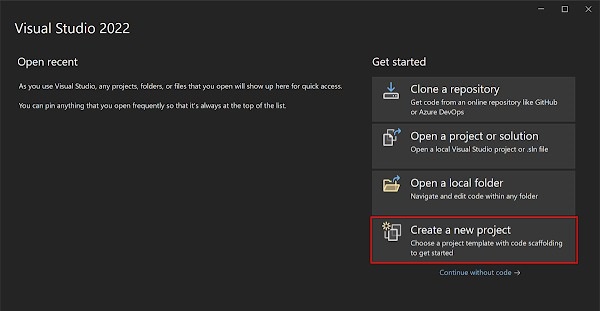
To create a new project, launch Visual Studio 2022 and select Create a new project from the Start box.
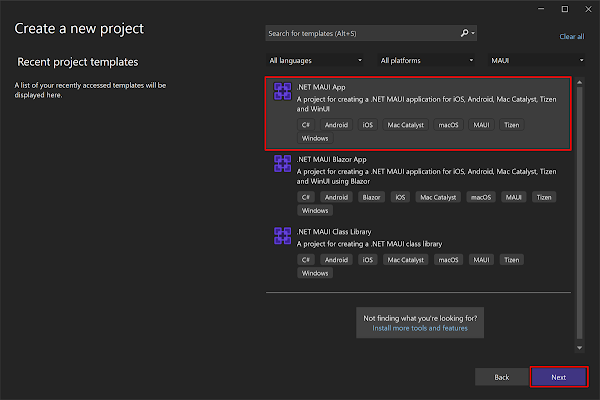
Click the Next button after choosing the.NET MAUI App template and MAUI from the All project types drop-down menu in the Create a new project box.
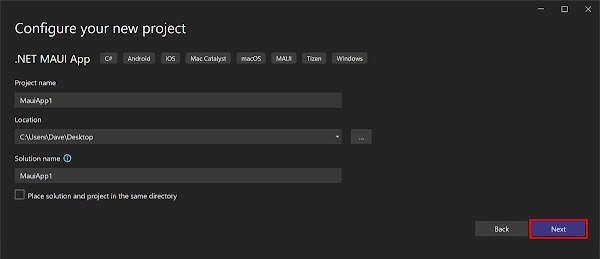
Click the Next button after giving your project a name and selecting an appropriate location in the Configure your new project window.
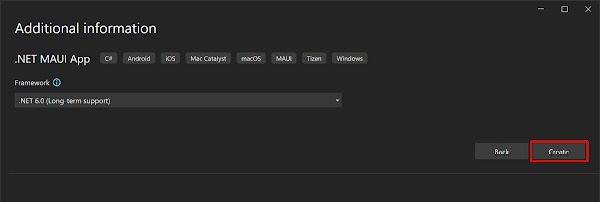
Click the Create button located in the Additional Information window.
Once the project is created, we can able to see the Android, iOS, Windows, and other running options in the toolbar. Press the emulator or run button to build and run the app.

Install Plugin
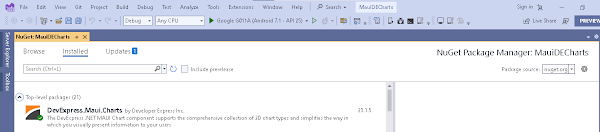
- Library Requirement: The Dev Express's Nuget link should be mapped as a package source and we need to install "DevExpress.Maui.Charts" into our project.
- Installation via NuGet: Obtain the Charts library by searching for "DevExpress.Maui.Charts" in the NuGet Package Manager.
- User Interface Guidance: Open the NuGet Package Manager interface to facilitate the installation process.
- Visual Confirmation: The library, once searched, should appear as "DevExpress.Maui.Charts" in the NuGet interface.
Implementation
First, we need to open "MauiProgram.cs" and include the following namespace and line to allow the app to use the Chart Library.
using DevExpress.Maui;
.UseDevExpress()
Open the MainPage.xaml file and add the following namespace. (the page will be replaced according to you).
xmlns:dxc="clr-namespace:DevExpress.Maui.Charts;assembly=DevExpress.Maui.Charts"
Then, remove the default content and add an instance of the ChartView class to the page.
<ContentPage xmlns="http://schemas.microsoft.com/dotnet/2021/maui"
xmlns:x="http://schemas.microsoft.com/winfx/2009/xaml"
xmlns:dxc="clr-namespace:DevExpress.Maui.Charts;assembly=DevExpress.Maui.Charts"
x:Class="ScatterChartGetStarted.MainPage">
<dxc:ChartView/>
</ContentPage>
Consider removing the event handlers from the code behind the default content. It is advisable to eliminate default styles (such as fonts, colors, and other settings) in the App.xaml file as well.
In this instance, the chart features a line series displaying the annual GDP for three countries. Generate a ViewModel.cs file that includes the following classes.
public class ViewModel {
public CountryGdp GdpValueForUSA { get; }
public CountryGdp GdpValueForChina { get; }
public CountryGdp GdpValueForJapan { get; }
public ViewModel() {
GdpValueForUSA = new CountryGdp(
"USA",
new GdpValue(new DateTime(2020, 1, 1), 20.93),
new GdpValue(new DateTime(2019, 1, 1), 21.43),
new GdpValue(new DateTime(2018, 1, 1), 20.58),
new GdpValue(new DateTime(2017, 1, 1), 19.391),
new GdpValue(new DateTime(2016, 1, 1), 18.624),
new GdpValue(new DateTime(2015, 1, 1), 18.121),
new GdpValue(new DateTime(2014, 1, 1), 17.428),
new GdpValue(new DateTime(2013, 1, 1), 16.692),
new GdpValue(new DateTime(2012, 1, 1), 16.155),
new GdpValue(new DateTime(2011, 1, 1), 15.518),
new GdpValue(new DateTime(2010, 1, 1), 14.964)
);
GdpValueForChina = new CountryGdp(
"China",
new GdpValue(new DateTime(2020, 1, 1), 14.72),
new GdpValue(new DateTime(2019, 1, 1), 14.34),
new GdpValue(new DateTime(2018, 1, 1), 13.89),
new GdpValue(new DateTime(2017, 1, 1), 12.238),
new GdpValue(new DateTime(2016, 1, 1), 11.191),
new GdpValue(new DateTime(2015, 1, 1), 11.065),
new GdpValue(new DateTime(2014, 1, 1), 10.482),
new GdpValue(new DateTime(2013, 1, 1), 9.607),
new GdpValue(new DateTime(2012, 1, 1), 8.561),
new GdpValue(new DateTime(2011, 1, 1), 7.573),
new GdpValue(new DateTime(2010, 1, 1), 6.101)
);
GdpValueForJapan = new CountryGdp(
"Japan",
new GdpValue(new DateTime(2020, 1, 1), 4.888),
new GdpValue(new DateTime(2019, 1, 1), 5.082),
new GdpValue(new DateTime(2018, 1, 1), 4.955),
new GdpValue(new DateTime(2017, 1, 1), 4.872),
new GdpValue(new DateTime(2016, 1, 1), 4.949),
new GdpValue(new DateTime(2015, 1, 1), 4.395),
new GdpValue(new DateTime(2014, 1, 1), 4.850),
new GdpValue(new DateTime(2013, 1, 1), 5.156),
new GdpValue(new DateTime(2012, 1, 1), 6.203),
new GdpValue(new DateTime(2011, 1, 1), 6.156),
new GdpValue(new DateTime(2010, 1, 1), 5.700)
);
}
}
public class CountryGdp {
public string CountryName { get; }
public IList<GdpValue> Values { get; }
public CountryGdp(string country, params GdpValue[] values) {
this.CountryName = country;
this.Values = new List<GdpValue>(values);
}
}
public class GdpValue {
public DateTime Year { get; }
public double Value { get; }
public GdpValue(DateTime year, double value) {
this.Year = year;
this.Value = value;
}
}
In the MainPage.xaml file, incorporate three LineSeries objects into the ChartView.Series collection. To establish a connection between the series and data, assign each LineSeries object's Data property to a SeriesDataAdapter object. Utilize the adapter's properties to indicate the data source and fields containing arguments and values for each series.
Additionally, define a local XAML namespace referring to a CLR namespace encompassing the view model. Subsequently, employ the page's BindingContext property to link the view model with the view.
<ContentPage xmlns="http://schemas.microsoft.com/dotnet/2021/maui"
xmlns:x="http://schemas.microsoft.com/winfx/2009/xaml"
xmlns:dxc="clr-namespace:DevExpress.Maui.Charts;assembly=DevExpress.Maui.Charts"
xmlns:ios="clr-namespace:Microsoft.Maui.Controls.PlatformConfiguration.iOSSpecific;assembly=Microsoft.Maui.Controls"
ios:Page.UseSafeArea="True"
xmlns:local="clr-namespace:MauiDevExpress"
x:Class="MauiDevExpress.MainPage">
<ContentPage.BindingContext>
<local:ViewModel/>
</ContentPage.BindingContext>
<dxc:ChartView>
<dxc:ChartView.Series>
<dxc:LineSeries DisplayName="{Binding GdpValueForUSA.CountryName}">
<dxc:LineSeries.Data>
<dxc:SeriesDataAdapter DataSource="{Binding GdpValueForUSA.Values}"
ArgumentDataMember="Year">
<dxc:ValueDataMember Type="Value" Member="Value"/>
</dxc:SeriesDataAdapter>
</dxc:LineSeries.Data>
</dxc:LineSeries>
<dxc:LineSeries DisplayName="{Binding GdpValueForChina.CountryName}">
<dxc:LineSeries.Data>
<dxc:SeriesDataAdapter DataSource="{Binding GdpValueForChina.Values}"
ArgumentDataMember="Year">
<dxc:ValueDataMember Type="Value" Member="Value"/>
</dxc:SeriesDataAdapter>
</dxc:LineSeries.Data>
</dxc:LineSeries>
<dxc:LineSeries DisplayName="{Binding GdpValueForJapan.CountryName}">
<dxc:LineSeries.Data>
<dxc:SeriesDataAdapter DataSource="{Binding GdpValueForJapan.Values}"
ArgumentDataMember="Year">
<dxc:ValueDataMember Type="Value" Member="Value"/>
</dxc:SeriesDataAdapter>
</dxc:LineSeries.Data>
</dxc:LineSeries>
</dxc:ChartView.Series>
</dxc:ChartView>
</ContentPage>
Configure the X-axis to display labels for years by assigning a DateTimeAxisX object with the specified settings to the ChartView.AxisX property.
<dxc:ChartView> <dxc:ChartView.AxisX>
<dxc:DateTimeAxisX MeasureUnit="Year" GridAlignment="Year"
GridSpacing="2"/> </dxc:ChartView.AxisX> </dxc:ChartView>
Configure the title and labels on the Y-axis. Set the ChartView.AxisY property to a NumericAxisY object and specify this object’s Title and Label properties.
<dxc:ChartView>
<!-- The X-axis config is here. -->
<dxc:ChartView.AxisY>
<dxc:NumericAxisY>
<dxc:NumericAxisY.Title>
<dxc:AxisTitle Text="Trillions of US$">
<dxc:AxisTitle.Style>
<dxc:TitleStyle>
<dxc:TitleStyle.TextStyle>
<dxc:TextStyle Size="16"/>
</dxc:TitleStyle.TextStyle>
</dxc:TitleStyle>
</dxc:AxisTitle.Style>
</dxc:AxisTitle>
</dxc:NumericAxisY.Title>
<dxc:NumericAxisY.Label>
<dxc:AxisLabel TextFormat="#.#" Position="Inside"/>
</dxc:NumericAxisY.Label>
</dxc:NumericAxisY>
</dxc:ChartView.AxisY>
</dxc:ChartView>
Configure the legend position and orientation. Set the ChartView.Legend property to a Legend object, and specify this object’s properties as follows.
<dxc:ChartView>
<dxc:ChartView.Legend>
<dxc:Legend VerticalPosition="TopOutside"
HorizontalPosition="Center"
Orientation="LeftToRight"/>
</dxc:ChartView.Legend>
</dxc:ChartView>
Establish the chart to showcase a series point hint as a crosshair cursor by setting the ChartView.Hint property to a Hint object and assigning a CrosshairHintBehavior object to Hint.Behavior. Subsequently, define the hint's content, data format, and visibility options. Set the LineSeries.HintOptions property to a SeriesCrosshairOptions object with the specified settings.
<ContentPage.Resources>
<dxc:SeriesCrosshairOptions x:Key="lineSeriesHintOptions"
PointTextPattern="{}{S}: {V}M"
ShowInLabel="True"
AxisLabelVisible="True"
AxisLineVisible="True"/>
</ContentPage.Resources>
<dxc:ChartView>
<dxc:ChartView.Hint>
<dxc:Hint>
<dxc:Hint.Behavior>
<dxc:CrosshairHintBehavior GroupHeaderTextPattern="{}{A$YYYY}"
MaxSeriesCount="3"/>
</dxc:Hint.Behavior>
</dxc:Hint>
</dxc:ChartView.Hint>
<dxc:ChartView.Series>
<dxc:LineSeries HintOptions="{StaticResource lineSeriesHintOptions}">
<!--Series Data-->
</dxc:LineSeries>
<dxc:LineSeries HintOptions="{StaticResource lineSeriesHintOptions}">
<!--Series Data-->
</dxc:LineSeries>
<dxc:LineSeries HintOptions="{StaticResource lineSeriesHintOptions}">
<!--Series Data-->
</dxc:LineSeries>
</dxc:ChartView.Series>
</dxc:ChartView>
Set the LineSeries.MarkersVisible property to True to display point markers. To change the line series appearance, set the LineSeries.Style property to a LineSeriesStyle object. This object’s Stroke, StrokeThickness, MarkerSize, and MarkerStyle properties allow you to configure the appearance of the series line and point markers.
<dxc:LineSeries MarkersVisible="True">
<!--Series Data-->
<dxc:LineSeries.Style>
<dxc:LineSeriesStyle Stroke="#7145a7" StrokeThickness="2" MarkerSize="8">
<dxc:LineSeriesStyle.MarkerStyle>
<dxc:MarkerStyle Fill="#7145a7"/>
</dxc:LineSeriesStyle.MarkerStyle>
</dxc:LineSeriesStyle>
</dxc:LineSeries.Style>
</dxc:LineSeries>